Performance API 开发指南
Performance API 是一组用于衡量 Web 应用性能的标准。本文档详细介绍了 Performance API 的各种接口和功能,帮助开发者构建高性能的 Web 应用。
目录导航
- 概述与基础概念
- Performance 主接口
- PerformanceObserver 监听器
- PerformanceEntry 条目对象
- PerformanceResourceTiming 资源时序
- PerformancePaintTiming 绘制时序
- PerformanceEventTiming 事件时序
- PerformanceServerTiming 服务器时序
- LayoutShift 布局偏移
1. 概述与基础概念
1.1 什么是 Performance API
Performance API 是一组用于衡量 Web 应用性能的标准。它提供了重要的内置指标,并能够将自定义的测量结果添加到浏览器的性能时间线(Performance Timeline)中。
1.2 性能时间线结构
每一个性能指标都使用一个性能条目(PerformanceEntry)表示。性能条目有以下核心属性:
- name:性能条目的名称
- duration:持续时间
- startTime:开始时间
- type:条目类型
1.3 Performance API 架构

Performance 主接口在 Window 和 Worker 全局作用域下都可用,允许开发者:
- 添加自定义性能条目
- 清除性能条目
- 查询性能条目
- 监听性能事件
2. Performance 主接口
2.1 属性和方法概览
| 属性/方法 | 类型 | 描述 |
|---|---|---|
eventCounts | 属性 | PerformanceEventTiming 支持事件的 Map 结构对象 |
now() | 方法 | 返回从性能测量时刻开始经过的毫秒数 |
mark() | 方法 | 在性能缓冲区中创建标记 |
measure() | 方法 | 在指定标记间创建测量 |
clearMarks() | 方法 | 清除指定标记 |
clearMeasures() | 方法 | 清除指定测量 |
clearResourceTiming() | 方法 | 清除资源时序条目 |
getEntries() | 方法 | 获取所有性能条目 |
getEntriesByName() | 方法 | 根据名称获取条目 |
getEntriesByType() | 方法 | 根据类型获取条目 |
setResourceTimingBufferSize() | 方法 | 设置资源时序缓冲区大小 |
toJSON() | 方法 | 返回 JSON 表示 |
2.2 基本使用示例
/**
 * 性能条目操作示例
 */
function usePerformanceEntryMethods() {
  console.log("PerformanceEntry tests ...");

  if (performance.mark === undefined) {
    console.log("... performance.mark Not supported");
    return;
  }

  // 创建性能标记
  performance.mark("Begin");
  doWork(50000);
  performance.mark("End");

  performance.mark("Begin");
  doWork(100000);
  performance.mark("End");

  doWork(200000);
  performance.mark("End");

  // 使用 getEntries() 遍历每个条目
  const entries = performance.getEntries();
  console.log("All entries:", entries);

  // 获取特定条目
  const specificEntries = performance.getEntries({
    name: "Begin",
    entryType: "mark"
  });
  console.log("Specific entries:", specificEntries);

  // 按类型获取条目
  const markEntries = performance.getEntriesByType("mark");
  console.log("Mark entries:", markEntries);

  // 按名称获取条目
  const beginEntries = performance.getEntriesByName("Begin", "mark");
  console.log("Begin entries:", beginEntries);
}

/**
 * 模拟工作负载
 */
function doWork(iterations) {
  for (let i = 0; i < iterations; i++) {
    // 模拟工作
  }
}2.3 获取性能条目
/**
 * 获取性能条目的不同方式
 */
const entries = window.performance.getEntriesByName(name, type);

// 获取所有条目
const allEntries = performance.getEntries();

// 获取特定类型的条目
const resourceEntries = performance.getEntriesByType("resource");

// 获取特定名称的条目
const specificEntries = performance.getEntriesByName("example", "mark");3. PerformanceObserver 监听器
3.1 基本概念
PerformanceObserver 用于监测性能度量事件,在浏览器的性能时间轴记录新的 Performance Entry 时会被通知。
3.2 属性和方法
| 属性/方法 | 类型 | 描述 |
|---|---|---|
supportedEntryTypes | 静态属性 | 返回支持的 entryTypes 列表 |
disconnect() | 方法 | 停止接收性能条目事件 |
observe(options) | 方法 | 开始观察指定类型的性能条目 |
takeRecords() | 方法 | 获取并清空当前存储的性能条目 |
3.3 支持的条目类型
// 检查支持的条目类型
console.log(PerformanceObserver.supportedEntryTypes);

// 主线程中 Chrome 129 的返回值示例:
// ["element", "event", "first-input", "largest-contentful-paint",
//  "layout-shift", "long-animation-frame", "longtask", "mark",
//  "measure", "navigation", "paint", "resource", "visibility-state"]

// Worker 线程中 Chrome 129 的返回值示例:
// ["mark", "measure", "resource"]

// 检查是否支持特定类型
if (PerformanceObserver.supportedEntryTypes.includes("resource")) {
  // 支持 resource entryType 的逻辑
  console.log("Resource timing is supported");
}3.4 创建和使用观察者
/**
 * 创建性能观察者
 * @param {Function} callback - 回调函数
 * @param {Object} list - PerformanceObserverEntryList 对象
 * @param {Object} observer - 观察者对象
 */
const observer = new PerformanceObserver(function(list, observer) {
  const entries = list.getEntries();

  for (let i = 0; i < entries.length; i++) {
    const entry = entries[i];
    console.log(`Entry: ${entry.name}, Duration: ${entry.duration}`);
  }

  // 停止记录性能条目
  observer.disconnect();
});

// 开始观察
observer.observe({ entryTypes: ["mark", "measure", "navigation"] });

// 获取记录的条目
const records = observer.takeRecords();
if (records.length > 0) {
  console.log("First record name:", records[0].name);
  console.log("First record start time:", records[0].startTime);
  console.log("First record duration:", records[0].duration);
}

// 停止观察
observer.disconnect();4. PerformanceEntry 条目对象
4.1 基本概念
PerformanceEntry 对象代表了性能时间列表中的单个度量数据。每个性能条目都可以通过手动构建标记或测量生成,也可以在资源加载时被动生成。
4.2 核心属性
| 属性 | 类型 | 描述 |
|---|---|---|
name | String | 性能条目的名称 |
entryType | String | 条目类型 |
startTime | Number | 度量开始时间 |
duration | Number | 事件持续时间 |
4.3 条目类型
frame- 帧时序navigation- 导航时序resource- 资源时序mark- 标记measure- 测量paint- 绘制时序event- 事件时序
4.4 VisibilityStateEntry 可见性状态条目
/**
 * 监听页面可见性状态变化
 */
const fcpEntry = performance.getEntriesByName("first-contentful-paint")[0];
const visibilityStateEntries = performance.getEntriesByType("visibility-state")[0];

console.log("Visibility state entry:", visibilityStateEntries);

// 输出示例:
// {
//   "name": "visible",           // 返回 "visible" 或 "hidden"
//   "entryType": "visibility-state",
//   "startTime": 0,             // 可见性状态发生更改时的时间戳
//   "duration": 0               // 总是返回 0
// }5. PerformanceResourceTiming 资源时序
5.1 概述
Resource Timing API 提供了获取和分析应用资源加载详细网络时序数据的能力。它为网络事件生成高分辨率时间戳,提供资源加载时间线。
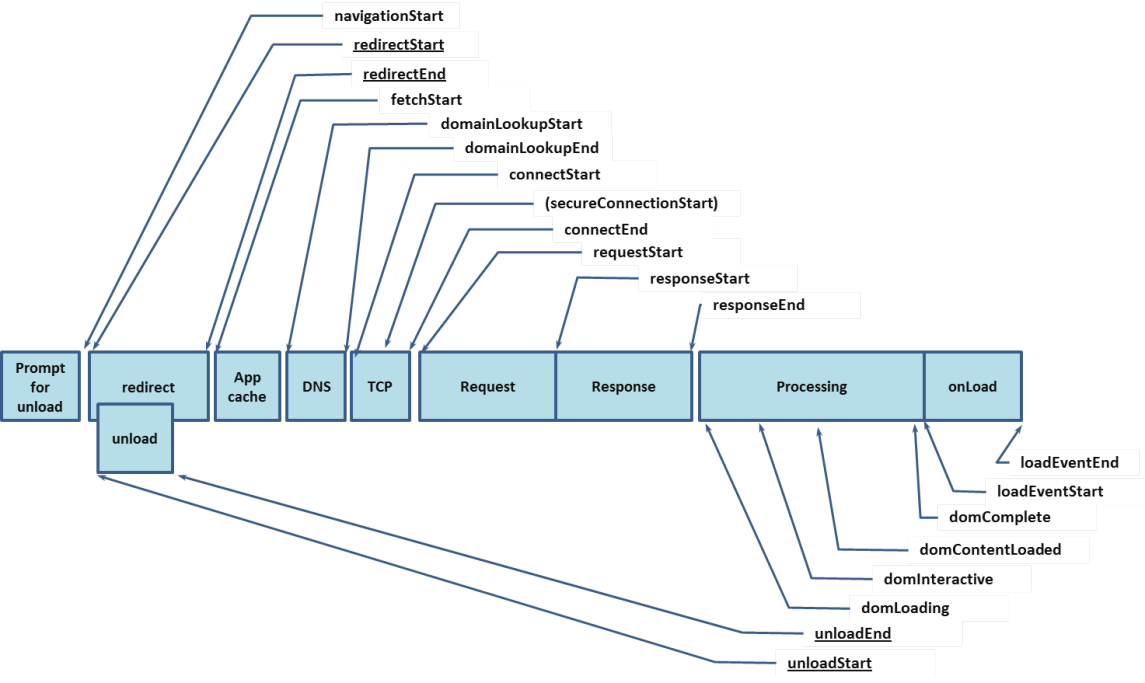
5.2 时序阶段
/**
 * 资源时序的各个阶段
 */
const resourceTiming = performance.getEntriesByType('resource')[0];

console.log("Resource timing details:", {
  // 资源加载开始时间
  startTime: resourceTiming.startTime,

  // 获取开始时间(包含重定向和DNS查找)
  fetchStart: resourceTiming.fetchStart,

  // 域名查找开始时间
  domainLookupStart: resourceTiming.domainLookupStart,
  domainLookupEnd: resourceTiming.domainLookupEnd,

  // 连接开始和结束时间
  connectStart: resourceTiming.connectStart,
  connectEnd: resourceTiming.connectEnd,

  // HTTPS 连接开始时间
  secureConnectionStart: resourceTiming.secureConnectionStart,

  // 请求开始时间
  requestStart: resourceTiming.requestStart,

  // 响应开始和结束时间
  responseStart: resourceTiming.responseStart,
  responseEnd: resourceTiming.responseEnd,

  // 资源大小信息
  decodedBodySize: resourceTiming.decodedBodySize,
  encodedBodySize: resourceTiming.encodedBodySize,
  transferSize: resourceTiming.transferSize
});5.3 资源时序示例
/**
 * 获取资源时序信息
 */
  const performanceResourceTimingEntry = performance.getEntriesByType('resource')[0];
console.log(performanceResourceTimingEntry);

// 输出示例:
// {
//   connectEnd: 138.11499997973442,
//   connectStart: 138.11499997973442,
//   decodedBodySize: 33808,
//   domainLookupEnd: 138.11499997973442,
//   domainLookupStart: 138.11499997973442,
//   duration: 0,
//   encodedBodySize: 33808,
//   entryType: "resource",
//   fetchStart: 138.11499997973442,
//   initiatorType: "link",
//   name: "https://static.example.com/image.png",
//   nextHopProtocol: "h2",
//   redirectEnd: 0,
//   redirectStart: 0,
//   requestStart: 138.11499997973442,
//   responseEnd: 138.11499997973442,
//   responseStart: 138.11499997973442,
//   secureConnectionStart: 0,
//   serverTiming: [],
//   startTime: 138.11499997973442,
//   transferSize: 0,
    //   workerStart: 0
// }6. PerformancePaintTiming 绘制时序
6.1 概述
Paint Timing API 提供页面在构建过程中的"绘制"时间点信息。绘制是指将渲染树转换为页面像素的过程。
6.2 绘制类型
- First Paint (FP):首次绘制任何内容的时间
- First Contentful Paint (FCP):首次绘制 DOM 文本或图像内容的时间
- Largest Contentful Paint (LCP):最大内容绘制时间
6.3 首次绘制和首次内容绘制
/**
 * 获取绘制时序信息
 */
function showPaintTimings() {
  if (window.performance) {
    const performance = window.performance;

    // 获取绘制相关的性能条目
    const performanceEntries = performance.getEntriesByType("paint");

    performanceEntries.forEach((entry, index) => {
      console.log(`Paint entry ${index}:`, entry);
    });
  } else {
    console.log("Performance timing isn't supported.");
  }
}

// 调用函数
showPaintTimings();

// 输出示例:
// [
//   {
//     name: "first-paint",
//     entryType: "paint",
//     startTime: 785.3999999761581,
//     duration: 0
//   },
//   {
//     name: "first-contentful-paint",
//     entryType: "paint",
//     startTime: 785.3999999761581,
//     duration: 0
//   }
// ]6.4 最大内容绘制(LCP)
/**
 * 监听最大内容绘制事件
 */
const lcpObserver = new PerformanceObserver((list) => {
  const entries = list.getEntries();
  const lastEntry = entries[entries.length - 1]; // 使用最新的 LCP 候选

  console.log("LCP:", lastEntry.startTime);
  console.log("LCP details:", lastEntry);
});

lcpObserver.observe({
  type: "largest-contentful-paint",
  buffered: true
});

// 输出示例:
// {
//   "name": "",
//   "element": [object HTMLElement],     // 当前最大内容绘制的元素
//   "entryType": "largest-contentful-paint",
//   "startTime": 704.8999999761581,
//   "duration": 0,
//   "size": 53969,                       // 元素固有大小(宽度 * 高度)
//   "renderTime": 704.8999999761581,     // 元素渲染到屏幕的时间
//   "loadTime": 0,                       // 元素加载时间
//   "firstAnimatedFrameTime": 0,
//   "id": "",                            // 元素的 ID
//   "url": ""                            // 如果是图像,则为图像 URL
// }7. PerformanceEventTiming 事件时序
7.1 概述
Event Timing API 提供了对用户交互触发的某些事件类型延迟的深入了解。此 API 对于测量首次输入延迟(FID)特别有用。
7.2 支持的事件类型
| 事件类型 | 包含的事件 |
|---|---|
| 点击事件 | auxclick, click, dblclick, contextmenu |
| 合成事件 | compositionstart, compositionupdate, compositionend |
| 拖放事件 | dragstart, dragend, dragenter, dragover, dragleave, drop |
| 输入事件 | beforeinput, input |
| 键盘事件 | keypress, keydown, keyup |
| 鼠标事件 | mousedown, mouseup, mouseout, mouseenter, mouseover, mouseleave |
| 指针事件 | pointerover, pointerenter, pointerdown, pointerup, pointercancel, pointerout, pointerleave, gotpointercapture, lostpointercapture |
| 触摸事件 | touchstart, touchend, touchcancel |
注意:以下连续事件不包括在列表中:mousemove、pointermove、pointerrawupdate、touchmove、wheel、drag
7.3 事件时序监听
/**
 * 监听事件时序
 */
const eventObserver = new PerformanceObserver((list) => {
  list.getEntries().forEach((entry) => {
    // 总持续时间
    const duration = entry.duration;

    // 输入延迟时间:从用户交互到事件处理器响应之前
    const delay = entry.processingStart - entry.startTime;

    // 事件处理程序运行时间(同步任务)
    const eventHandlerTime = entry.processingEnd - entry.processingStart;

    console.log(`Event: ${entry.name}`);
    console.log(`Total duration: ${duration}ms`);
    console.log(`Input delay: ${delay}ms`);
    console.log(`Event handler duration: ${eventHandlerTime}ms`);
    console.log("Full entry:", entry);
  });
});

// 注册事件观察者
eventObserver.observe({ type: "event", buffered: true });

// 输出条目示例:
// {
//   "name": "pointerover",               // 关联事件的类型
//   "entryType": "event",                // 条目类型
//   "startTime": 428.7999999523163,
//   "duration": 296,
//   "interactionId": 0,                  // 用户交互的唯一标识符
//   "processingStart": 443.60000002384186,  // 事件调度开始时间
//   "processingEnd": 443.60000002384186,    // 事件调度结束时间
//   "cancelable": true,                  // 事件的 cancelable 属性
//   "target": [object HTMLElement]       // 事件的最后目标
// }8. PerformanceServerTiming 服务器时序
8.1 概述
PerformanceServerTiming 接口显示与 Server-Timing HTTP 标头中响应一起发送的服务器指标。
注意:此功能仅在安全上下文(HTTPS)中可用,并且在 Web Worker 中也可用。
8.2 服务器端设置
/**
 * Node.js 服务器示例
 */
const http = require("http");

function requestHandler(request, response) {
  const headers = {
    "Server-Timing": `
      cache;desc="Cache Read";dur=23.2,
      db;dur=53,
      app;dur=47.2
    `.replace(/\n/g, ""),
  };

  response.writeHead(200, headers);
  response.write("");

  return setTimeout(() => {
    response.end();
  }, 1000);
}

http.createServer(requestHandler).listen(3000).on("error", console.error);8.3 客户端监听
/**
 * 使用 PerformanceObserver 监听服务器时序
 */
const serverTimingObserver = new PerformanceObserver(list => {
  list.getEntries().forEach(entry => {
    entry.serverTiming.forEach(serverEntry => {
      console.log(
        `${serverEntry.name} (${serverEntry.description}) duration: ${serverEntry.duration}ms`
      );
    });
  });
});

["navigation", "resource"].forEach(type =>
  serverTimingObserver.observe({ type, buffered: true })
);

// 输出示例:
// cache (Cache Read) duration: 23.2ms
// db () duration: 53ms
// app () duration: 47.2ms8.4 使用 getEntriesByType 获取服务器时序
/**
 * 使用 Performance.getEntriesByType() 获取服务器时序
 */
for (const entryType of ["navigation", "resource"]) {
  const entries = performance.getEntriesByType(entryType);

  for (const { name: url, serverTiming } of entries) {
    if (serverTiming && serverTiming.length > 0) {
      console.log(`URL: ${url}`);

      for (const { name, description, duration } of serverTiming) {
        console.log(`  ${name} (${description}) duration: ${duration}ms`);
      }
    }
  }
}9. LayoutShift 布局偏移
9.1 概述
Layout Shift 是指视区中可见元素在两个帧之间更改位置的现象。Layout Instability API 提供了测量和报告布局偏移的方法,用于计算累积布局偏移(CLS)分数。
9.2 布局偏移的原因
布局偏移通常由以下原因引起:
- 未指定
width和height属性的<img>或<video>元素 - 动态插入的内容
- 字体加载导致的文本重排
- 广告或其他第三方内容的加载
9.3 监听布局偏移
/**
 * 监听布局偏移事件
 */
const layoutShiftObserver = new PerformanceObserver((list) => {
  for (const entry of list.getEntries()) {
    // 只统计非用户输入引起的布局偏移
    if (!entry.hadRecentInput) {
      console.log("LayoutShift value:", entry.value);

      // 检查偏移源
      if (entry.sources) {
        for (const { node, currentRect, previousRect } of entry.sources) {
          console.log("LayoutShift source:", node, {
            currentRect,
            previousRect,
          });
      }
    }
    }

    console.log("Full layout shift entry:", entry);
  }
});

layoutShiftObserver.observe({ type: "layout-shift", buffered: true });9.4 布局偏移条目属性
// 输出 LayoutShift 条目示例:
// {
//   "name": "",                          // 总是空字符串
//   "entryType": "layout-shift",         // 总是 "layout-shift"
//   "startTime": 1234.5,                 // 偏移发生的时间
//   "duration": 0,                       // 总是 0
//   "value": 0.025,                      // 偏移分数
//   "hadRecentInput": false,             // 是否由用户输入引起
//   "lastInputTime": 0,                  // 最后一次用户输入时间
//   "sources": [                         // 偏移源信息
//     {
//       "node": [object HTMLElement],    // 发生偏移的元素
//       "currentRect": {...},            // 当前位置
//       "previousRect": {...}            // 之前位置
//     }
//   ]
// }9.5 计算累积布局偏移(CLS)
/**
 * 计算累积布局偏移分数
 */
let cumulativeLayoutShift = 0;

const clsObserver = new PerformanceObserver((list) => {
  for (const entry of list.getEntries()) {
    if (!entry.hadRecentInput) {
      cumulativeLayoutShift += entry.value;
    }
  }

  console.log("Current CLS score:", cumulativeLayoutShift);
});

clsObserver.observe({ type: "layout-shift", buffered: true });

// 在页面卸载时报告最终的 CLS 分数
window.addEventListener('beforeunload', () => {
  console.log("Final CLS score:", cumulativeLayoutShift);
});10. 性能优化最佳实践
10.1 使用 Performance API 进行性能监控
/**
 * 综合性能监控实现
 */
class PerformanceMonitor {
  constructor() {
    this.metrics = new Map();
    this.initObservers();
  }

  initObservers() {
    // 监听核心 Web 指标
    this.observeWebVitals();

    // 监听资源加载
    this.observeResourceTiming();

    // 监听用户交互
    this.observeUserInteraction();
  }

  observeWebVitals() {
    // LCP 监听
    new PerformanceObserver((list) => {
      const entries = list.getEntries();
      const lastEntry = entries[entries.length - 1];
      this.metrics.set('LCP', lastEntry.startTime);
    }).observe({ type: 'largest-contentful-paint', buffered: true });

    // FID 监听
    new PerformanceObserver((list) => {
      const entries = list.getEntries();
      entries.forEach(entry => {
        if (entry.name === 'first-input') {
          const delay = entry.processingStart - entry.startTime;
          this.metrics.set('FID', delay);
        }
      });
    }).observe({ type: 'first-input', buffered: true });

    // CLS 监听
    let cumulativeLayoutShift = 0;
    new PerformanceObserver((list) => {
      list.getEntries().forEach(entry => {
        if (!entry.hadRecentInput) {
          cumulativeLayoutShift += entry.value;
        }
      });
      this.metrics.set('CLS', cumulativeLayoutShift);
    }).observe({ type: 'layout-shift', buffered: true });
  }

  observeResourceTiming() {
    new PerformanceObserver((list) => {
      list.getEntries().forEach(entry => {
        if (entry.duration > 100) {
          console.warn(`Slow resource: ${entry.name} took ${entry.duration}ms`);
        }
      });
    }).observe({ type: 'resource', buffered: true });
  }

  observeUserInteraction() {
    new PerformanceObserver((list) => {
      list.getEntries().forEach(entry => {
        const delay = entry.processingStart - entry.startTime;
        if (delay > 100) {
          console.warn(`Slow interaction: ${entry.name} had ${delay}ms delay`);
        }
      });
    }).observe({ type: 'event', buffered: true });
  }

  getMetrics() {
    return Object.fromEntries(this.metrics);
  }

  report() {
    const metrics = this.getMetrics();
    console.log('Performance Metrics:', metrics);

    // 发送到分析服务
    // this.sendToAnalytics(metrics);
  }
}

// 使用示例
const monitor = new PerformanceMonitor();

// 在页面加载完成后报告指标
window.addEventListener('load', () => {
  setTimeout(() => {
    monitor.report();
  }, 1000);
});10.2 自定义性能测量
/**
 * 自定义性能测量工具
 */
class PerformanceMeasurer {
  static measure(name, fn) {
    const startMark = `${name}-start`;
    const endMark = `${name}-end`;
    const measureName = `${name}-measure`;

    performance.mark(startMark);

    const result = fn();

    performance.mark(endMark);
    performance.measure(measureName, startMark, endMark);

    const measure = performance.getEntriesByName(measureName)[0];
    console.log(`${name} took ${measure.duration}ms`);

    // 清理标记
    performance.clearMarks(startMark);
    performance.clearMarks(endMark);
    performance.clearMeasures(measureName);

    return result;
  }

  static async measureAsync(name, asyncFn) {
    const startMark = `${name}-start`;
    const endMark = `${name}-end`;
    const measureName = `${name}-measure`;

    performance.mark(startMark);

    const result = await asyncFn();

    performance.mark(endMark);
    performance.measure(measureName, startMark, endMark);

    const measure = performance.getEntriesByName(measureName)[0];
    console.log(`${name} took ${measure.duration}ms`);

    // 清理标记
    performance.clearMarks(startMark);
    performance.clearMarks(endMark);
    performance.clearMeasures(measureName);

    return result;
  }
}

// 使用示例
const result = PerformanceMeasurer.measure('data-processing', () => {
  // 同步操作
  return processData();
});

const asyncResult = await PerformanceMeasurer.measureAsync('api-call', async () => {
  // 异步操作
  return await fetch('/api/data');
});总结
Performance API 为 Web 应用提供了全面的性能监控和分析能力。通过合理使用这些 API,开发者可以:
- 实时监控关键性能指标:如 LCP、FID、CLS 等 Web Vitals
- 分析资源加载性能:识别慢速资源和网络瓶颈
- 优化用户交互体验:减少输入延迟和响应时间
- 检测和修复布局偏移:提升页面稳定性
- 实现自定义性能测量:满足特定业务需求
掌握 Performance API 是构建高性能 Web 应用的重要技能,建议开发者在项目中积极应用这些技术来持续优化用户体验。